Informe de ingresos
La aplicación Eventos de Odoo crea informes personalizados basados en datos y análisis relacionados con los eventos. Estos informes pueden estar relacionados con los asistentes o los ingresos.
Esta documentación habla acerca de las opciones de informes relacionados con los ingresos.
Página de informes de ingresos
To access the Revenues reporting page, navigate to .
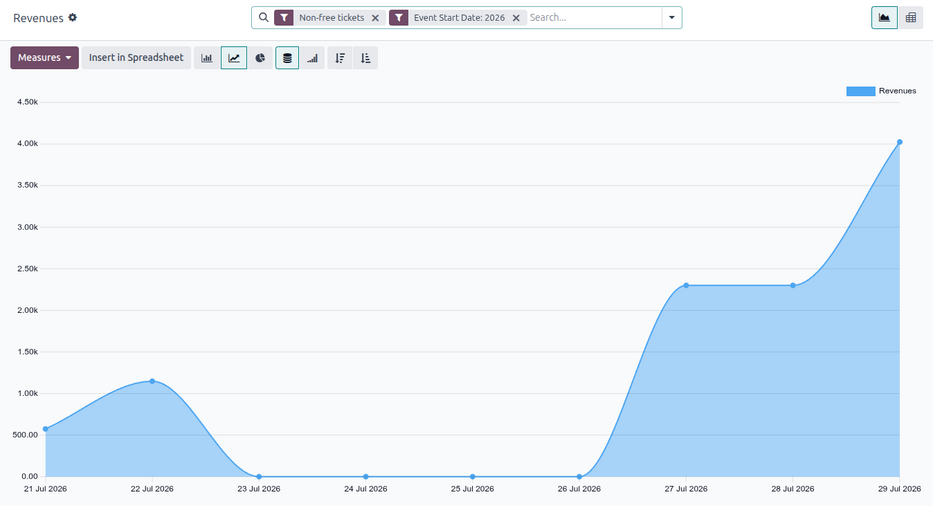
By default, the Revenues reporting page appears as a graph (a (Line Chart) with (Stacked) data). The default filters, Non-free tickets and Event Start Date: (current year), are applied in the search bar.
Truco
Consulte la documentación sobre las vistas de gráficos para obtener más información sobre las distintas vistas de gráficos (y sus respectivas opciones).
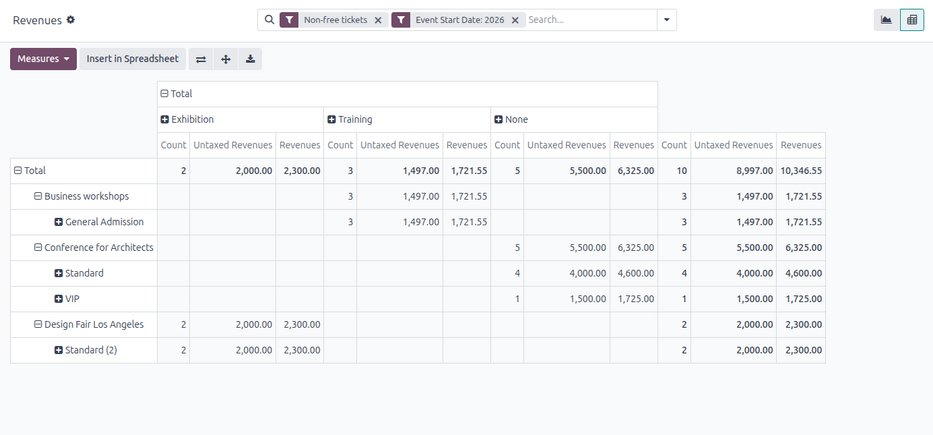
The Revenues reporting page can also be viewed as a pivot table, by clicking the (Pivot) icon in the upper-right corner.
Medidas
Choosing specific measures allows users to customize reporting pages.
Clicking the Measures drop-down button reveals the following options:
Revenues: Shows the revenues generated from events.
Untaxed Revenues: Shows the untaxed revenues generated from events.
Count: Shows the total number of registrants who attended events.
Nota
En la vista de gráfico solo es posible seleccionar una de las medidas disponibles a la vez.
Si la opción de tabla dinámica está activa entonces todas las opciones de medidas están seleccionadas de forma predeterminada.
Filtros y opciones de grupo
To reveal a drop-down menu of filter and grouping options, click the (down arrow) next to the search bar.
The drop-down menu allows users to set Filters and Group By options.
Nota
Si selecciona una opción relacionada con el tiempo en la columna Filtros (por ejemplo, el filtro predeterminado Fecha de inicio del evento: (año)), aparecerá la columna Comparación con distintas opciones de comparación para la opción seleccionada.
Solo puede elegir una opción en la columna Comparación a la vez.
Ver también
Opciones de filtro
The Filters column in the search bar’s drop-down menu allows users to restrict the data to specific criteria.
Multiple options in the Filters column can be selected at once. Options can be applied to any view.
La columna de filtros incluye las siguientes opciones:
Non-free tickets: Filter by event tickets/registrations that are not free.
Free: Filter by event tickets/registrations that are free.
Pending payment: Filter by event tickets/registrations that are purchased but are pending payment.
Sold: Filter by event tickets/registrations that are sold and paid for.
Registration Date: Filter by a specific registration date. Click the (down arrow) icon to reveal a list of month, quarter, and year options.
Upcoming/Running: Filter by current or future events.
Past Events: Filter by completed events.
Event Start Date: Filter by a specific event start date. Click the (down arrow) icon to reveal a list of month, quarter, and year options.
Event End Date: Filter by a specific event end date. Click the (down arrow) icon to reveal a list of month, quarter, and year options.
Published Events: Filter by published events.
Add Custom Filter: Create a custom filter to analyze event-related revenue data.
Opciones de grupo
The Group By column in the search bar’s drop-down menu allows users to group the data by specific criteria.
Puede seleccionar varias opciones en Agrupar por a la vez.
La columna Agrupar por incluye las siguientes opciones:
Tipo de evento: Agrupa los datos según el tipo de evento.
Evento: Organiza los datos en grupos separados por eventos.
Producto: Agrupa los datos según el producto en el registro del evento.
Entrada: Agrupa los datos según el tipo de entrada de evento comprada por los asistentes.
Estado de registro: Agrupa los datos según el estado de los registros.
Estado de la orden de venta: Agrupa los datos según el estado de las órdenes de venta relacionadas con el evento.
Cliente: Agrupa los datos según los registros de los clientes.
Add Custom Group: Create a custom group to organize data by additional fields. Click the (down arrow) icon to reveal a drop-down of grouping options. Multiple selections can be made.
Informe de muestra: análisis de entradas de eventos (gráfico)
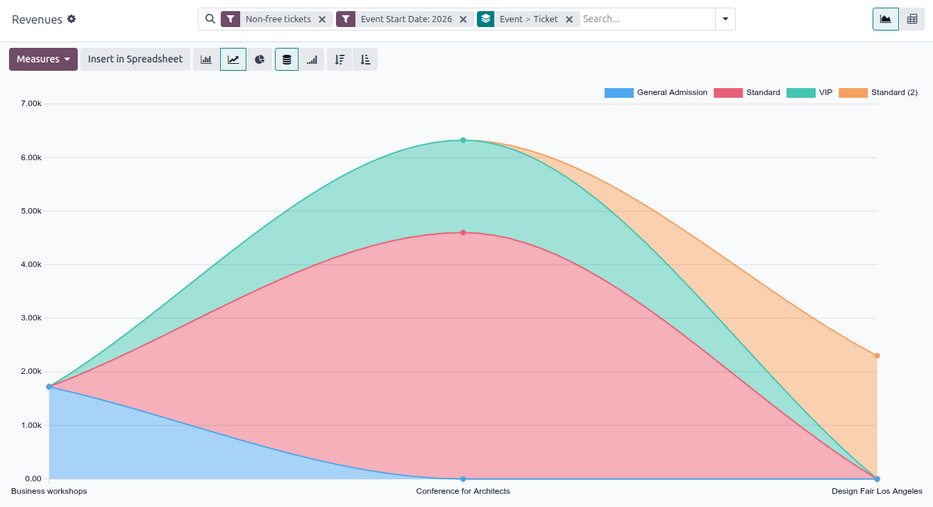
The following is an example of how various filters and grouping options can be used to compare the distributions of paid tickets and free tickets for published events, organized by ticket type and event.
To create this report, navigate to . Stay in the default graph view but remove the default filters from the search bar.
Then, click the (down arrow) next to the search bar. From here, select Free and Sold from the Filters column.
To view data related only to already published events, select the Published Events option in the Filters column.
Next, in the Group By column, select the Event and Ticket options, in that order. Doing so first groups the data by event, then by ticket type.
Importante
The order in which the options are selected in the Group By column directly affects how the data is grouped and displayed on the report.
Informe de muestra: análisis de tipo de evento (tabla dinámica)
The following is an example of how to create a report analyzing revenue by event type to determine which event types are most profitable.
First, navigate to and switch to the pivot table view by clicking the (Pivot) icon in the upper-right corner.
Mantenga los filtros predeterminados (Entradas no gratuitas y Fecha de inicio del evento: (año)) en la barra de búsqueda.
Next, open the Measures drop-down menu and deselect the option for Count as this report focuses only on revenues.
Luego, haga clic en Total que se encuentra arriba de los títulos de las columnas y seleccione Tipo de evento en el menú desplegable que aparece.
With these configurations, all revenues generated from the events and their corresponding registrations are organized by the event type.