考评分析
The Appraisals app has the ability to report on all the appraisals in the system, including past, present, and future appraisals, and their respective final ratings.
This report helps managers determine how employees are doing overall. If the majority of appraisals have a status of Needs improvement, it may indicate that employees need more training to successfully perform their jobs. If the majority of appraisals have a status of Strongly Exceed Expectations, it may indicate that employees are not challenged enough, and may benefit from promotions or increased levels of responsibility.
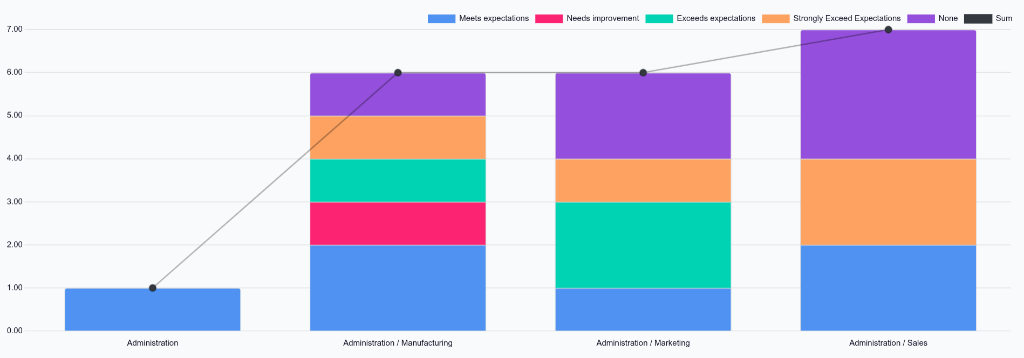
To view the Appraisal Analysis report, navigate to . On the Appraisal Analysis page, a report loads displaying all the appraisals in the database for the past 365 days, in a default stacked bar chart. Appraisals are grouped first by Department then Final Rating.
The displayed ratings correspond to the configured Evaluation Scale options. Each rating is color-coded on the report. The default options for the Evaluation Scale are as follows:
Meets expectations: Blue
Needs improvement: Red
Exceeds expectations: Green
Strongly Exceed Expectations: Orange
注解
If modifications are made to the Evaluation Scale, the colors and options may appear different.
Roll over any column’s segment to view the number of appraisals with the respective final rating. To view the specific appraisals within a segment, click on it. A list displaying each employee’s Name, Department, Appraisal Date, and Status for every appraisal appears. Return to the Appraisal Analysis report by clicking the breadcrumb menu.
The default report includes appraisals that have been scheduled but not completed (appraisals with a status of Confirmed or To Confirm). To only view completed appraisals, click into the search bar, then click Done in the Filters column. The report reloads, displaying only completed appraisals with a final rating.
To view only appraisals for the signed-in user’s team, click into the search bar and click My Team in the Filters column. This report only displays the employees the user manages. This allows the user to better understand their team’s performance by showing how many employees are performing either above or below expectations.
小技巧
To hide a metric from the report, click its label above the chart. Hidden metrics are indicated by a strikethrough on the label. Click the label again to make the metric visible.