Umsatzbericht
Odoo Veranstaltungen erstellt auf der Grundlage von veranstaltungsbezogenen Daten und Analysen benutzerdefinierte Berichte. Diese Berichte können sich entweder auf Teilenehmer oder Umsätze beziehen.
Die folgende Dokumentation handelt von den Berichtsoptionen in Bezug auf den Veranstaltungseinnahmen.
Seite der Einnahmenberichte
To access the Revenues reporting page, navigate to .
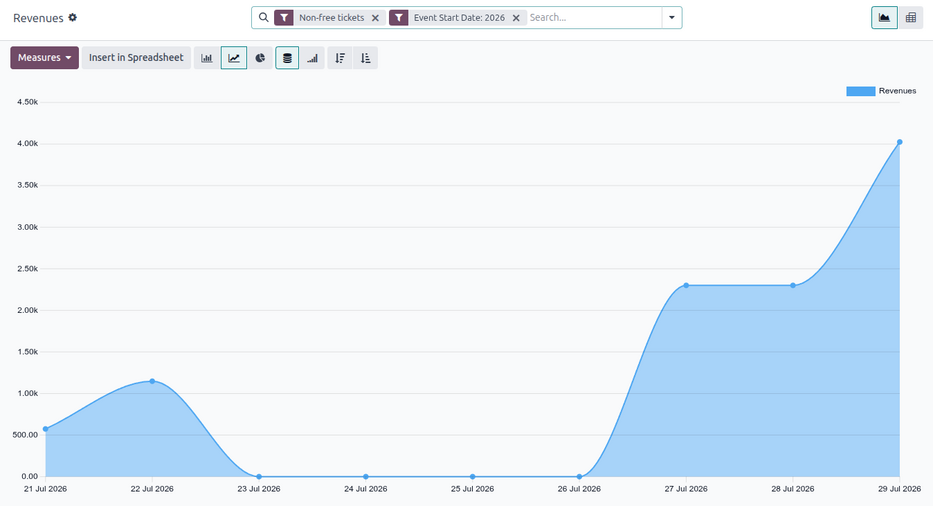
By default, the Revenues reporting page appears as a graph (a (Line Chart) with (Stacked) data). The default filters, Non-free tickets and Event Start Date: (current year), are applied in the search bar.
Tipp
Weitere Informationen zu den verschiedenen Diagrammansichten (und Optionen für die Diagrammansicht) finden Sie in der Dokumentation Diagrammansichten.
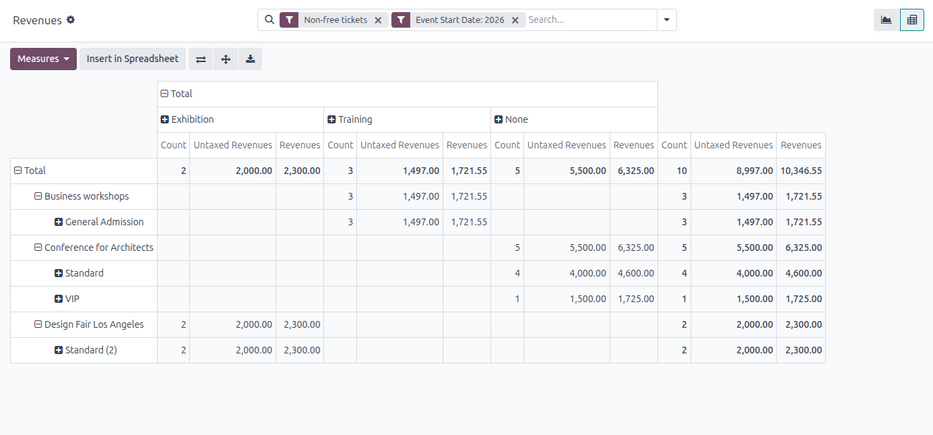
The Revenues reporting page can also be viewed as a pivot table, by clicking the (Pivot) icon in the upper-right corner.
Werte
Choosing specific measures allows users to customize reporting pages.
Clicking the Measures drop-down button reveals the following options:
Revenues: Shows the revenues generated from events.
Untaxed Revenues: Shows the untaxed revenues generated from events.
Count: Shows the total number of registrants who attended events.
Bemerkung
In der Diagrammansicht kann jeweils nur eine der Werte ausgewählt werden.
Wenn die Pivot-Option ausgewählt ist, sind standardmäßig alle Werte ausgewählt.
Filter- und Gruppierungsoptionen
To reveal a drop-down menu of filter and grouping options, click the (down arrow) next to the search bar.
The drop-down menu allows users to set Filters and Group By options.
Bemerkung
Wenn eine zeitbezogene Option aus der Spalte Filter ausgewählt wurde (z. B. der Standardfilter Startdatum der Veranstaltung: (Jahr)), erscheint eine Spalte Vergleich mit Vergleichsoptionen für die entsprechende ausgewählte zeitbezogene Filteroption.
In der Spalte Vergleich kann jeweils nur eine Auswahl getroffen werden.
Filteroptionen
The Filters column in the search bar’s drop-down menu allows users to restrict the data to specific criteria.
Multiple options in the Filters column can be selected at once. Options can be applied to any view.
Die Spalte Filter hat die folgenden Optionen:
Non-free tickets: Filter by event tickets/registrations that are not free.
Free: Filter by event tickets/registrations that are free.
Pending payment: Filter by event tickets/registrations that are purchased but are pending payment.
Sold: Filter by event tickets/registrations that are sold and paid for.
Registration Date: Filter by a specific registration date. Click the (down arrow) icon to reveal a list of month, quarter, and year options.
Upcoming/Running: Filter by current or future events.
Past Events: Filter by completed events.
Event Start Date: Filter by a specific event start date. Click the (down arrow) icon to reveal a list of month, quarter, and year options.
Event End Date: Filter by a specific event end date. Click the (down arrow) icon to reveal a list of month, quarter, and year options.
Published Events: Filter by published events.
Add Custom Filter: Create a custom filter to analyze event-related revenue data.
Optionen für „Gruppieren nach“
The Group By column in the search bar’s drop-down menu allows users to group the data by specific criteria.
Es können mehrere Optionen zum Gruppieren nach auf einmal ausgewählt werden.
Die Spalte Gruppieren nach hat die folgenden Optionen:
Veranstaltungstyp: Gruppieren Sie Daten basierend auf der Art der Veranstaltung.
Veranstaltung: Organisieren Sie Daten in einzelnen Gruppen für jede Veranstaltung.
Produkt: Gruppieren Sie Daten basierend auf dem Produkt für die Veranstaltungsregistrierung.
Ticket: Gruppieren Sie Daten basierend auf der Art der von Teilnehmern erworbenen Veranstaltungstickets.
Status der Registrierung: Gruppieren Sie Daten basierend auf dem Status der Registrierung.
Verkaufsauftragsstatus: Gruppieren Sie Daten basierend auf dem Status der veranstaltungsbezogenen Verkaufsaufträge.
Kunde: Gruppieren Sie Daten basierend auf Kundeneinträgen.
Add Custom Group: Create a custom group to organize data by additional fields. Click the (down arrow) icon to reveal a drop-down of grouping options. Multiple selections can be made.
Beispielbericht: Analyse der Veranstaltungstickets (Diagramm)
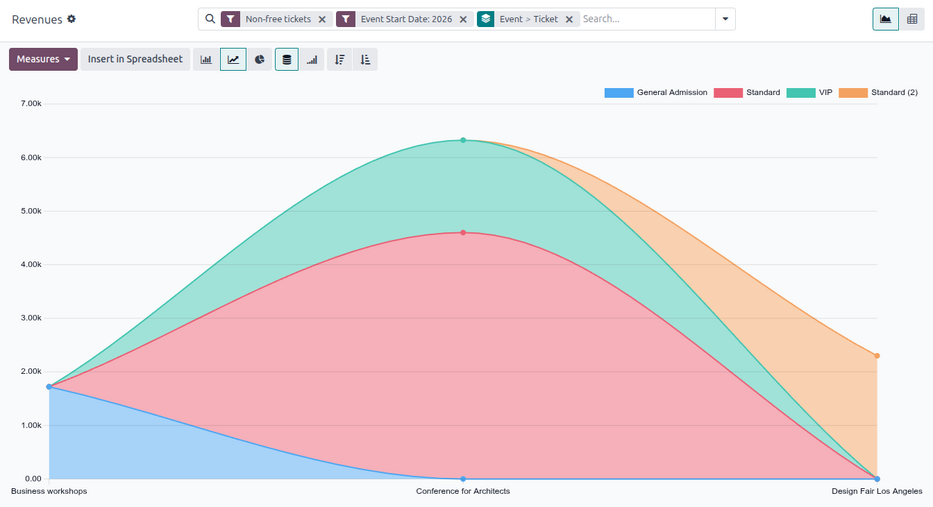
The following is an example of how various filters and grouping options can be used to compare the distributions of paid tickets and free tickets for published events, organized by ticket type and event.
To create this report, navigate to . Stay in the default graph view but remove the default filters from the search bar.
Then, click the (down arrow) next to the search bar. From here, select Free and Sold from the Filters column.
To view data related only to already published events, select the Published Events option in the Filters column.
Next, in the Group By column, select the Event and Ticket options, in that order. Doing so first groups the data by event, then by ticket type.
Wichtig
The order in which the options are selected in the Group By column directly affects how the data is grouped and displayed on the report.
Beispielbericht: Analyse des Veranstaltungstyps (Pivot-Tabelle)
The following is an example of how to create a report analyzing revenue by event type to determine which event types are most profitable.
First, navigate to and switch to the pivot table view by clicking the (Pivot) icon in the upper-right corner.
Behalten Sie die Standardfilter (Kostenpflichtige Tickets und Startdatum der Veranstaltung: (Jahr) in der Suchleiste.
Next, open the Measures drop-down menu and deselect the option for Count as this report focuses only on revenues.
Klicken Sie dann auf Gesamt oberhalb der Spaltentitel und wählen Sie Veranstaltungstyp aus dem sich ergebenden Drop-down-Menü.
With these configurations, all revenues generated from the events and their corresponding registrations are organized by the event type.